As much as I want to get multiple characters up and running around in Unreal Engine so I can see them, there’s one final task I must complete, and that is making sure this whole thing is actually going to work to the scale I want it to.
I want at least 200 players to be able to connect to a single server. Right now my server code basically contains all the logic necessary for running a MMORPG. I can add new entities, send inputs, calculate physics, and send back state. What this means is if I can’t handle 200 players now, I’ll never be able to handle 200 players when I add in AI, NPCs, path finding, visibility checks and so forth.
Load Testing
I wanted something quick and dirty, so for that I just did what any lazy hacker would do, started my server in one terminal and ran in another:
for i in `seq 1 50` ; do ./pmoclient & done
# wait some time....
killall -9 pmoclient
Then I checked my server.log to see how long each “tick” took. Where each tick is from after the call to world.progress() to when i finish a single game loop. I just realized as writing this that this method was a bit flawed as world.progress is where a lot of the code is actually executed, since that’s in flec’s systems. What this means is we need to calculate twice, one for my game loop and one for flecs world systems progress. But we’ll get to that later.
Using a for loop and loading up clients was expensive, mostly because those were running physics calculations on the client side, all I really need to do is have a basic client that opens a socket, sends inputs, gets responses. To make my testing easier, I decided to build a loadclient. I just wrapped up my normal net::Client and threw it in it’s own class / container. Now I can just send the necessary data and not really do any other calculations. Granted this is still janky because i’m starting up X number of threads each with their own lock free queues, but whatever it works.
Giving loadclient a go
OK so running 50 clients on my gaming / development box, inside WSLv2 by the way, I noticed my CPU spiking a bit…
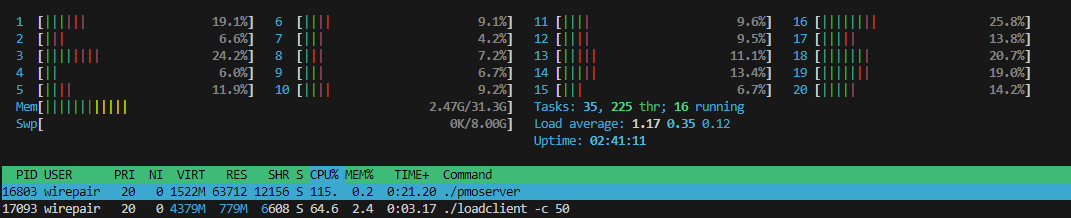
You can see my pmoserver taking up 115% CPU with 50 clients. This isn’t great, but it also doesn’t tell me anything. My tick rates seem well with in limits, but my CPU usage is high, I need more insight.
Enter perf & FlameGraph
I wanted to see a FlameGraph of what code blocks were taking up the most time, so I installed linux-tools-generic and setup perf. I started my server, started some clients and ran:
sudo perf record -F 99 -p `pidof pmoserver` -g -- sleep 30
After it chugged for a bit, I shut everything down and ran the little script that would help me automate an svg output:
#!/usr/bin/env bash

cp ~/netcode/pmo/scripts/perf.data perf.data
perf script | ./stackcollapse-perf.pl > out.perf-folded
./flamegraph.pl out.perf-folded > perf.svg
cp perf.svg /mnt/c/Users/isaac/Desktop/perf.svg
I was presented with this:

It might be hard to see, but more than half the CPU time was spent here, in my code, I was horrified:

I didn’t want to see my code like, at all, in the flame graph because that means I’m probably doing something terribly wrong. I wanted to see flecs + physics and that’s pretty much it. So I traced back to where ResendReliablePackets was being called and was mortified to see I was calling it from my network loop.
That loop is called every 1ms if there’s no network traffic to process from epoll. What does ResendReliablePackets do? It iterates over EVERY open client connection, checks if there’s any packets that aren’t Ack’d, and resends them. It also does some calculations on packet loss and samples data in queue, this is extremely expensive!
The Fix
The fix was to move the ResendReliablePackets logic to a game loop flecs system, meaning it’d only be called once per tick and only in particular cases (e.g. we have a valid client with the proper flecs components). This was done by adding a new LockFreeQueue IPC message type called ProcessReliableSocket, so that the socket thread will still control when we access those peer connections but I can signal it from the game thread.
// Tell Socket server to process reliable packets for all connected players
GameWorld.system<network::User, network::PMOServer, network::Connected>("ProcessSocketReliable")
		.each([&](flecs::iter& It, size_t Index, network::User &Network, network::PMOServer &Server, network::Connected &_)
{
    auto Process = std::make_unique<GameMessage>(Network.UserId, InternalMessage::ProcessReliableSocket);
    Process->Time = It.delta_time();
    Server.OutQueue->Push(std::move(Process));
});
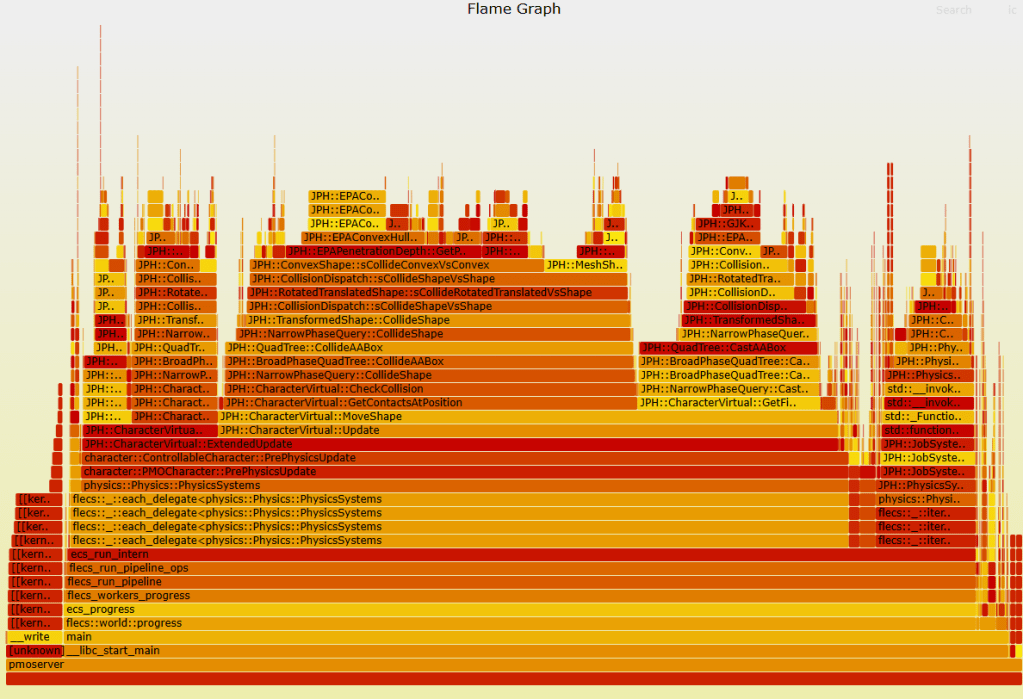
Re-running with the fix in place I was now presented with a MUCH better flame graph:

All large blocks are now in Jolt Physics and flecs systems, where I want them to be.
Testing setup
To really test this, I needed to move outside of my WSLv2 development box and into GCP. I chose a simple c2-standard-8 which is 8vCPUs with 32GB of memory for my server and the same setup for 2 clients for load testing. At first I wasn’t too happy with the tick data, it was high 20ms with some spikes into 200ms. Then I remembered I was running in debug build… While interesting that’s not a helpful metric. I rebuilt in Release and re-ran.
Rerunning with the tick rate fully calculated
Right, after building release, and adding more details for the tick counts. I re-ran a test on my production box with 300 clients again, this time also calculating how long GameWorld.Progress takes:
[2024-07-11 08:40:45.322] [server] [debug] Tick: 2.473308ms
[2024-07-11 08:40:45.354] [server] [debug] GameWorld.Progress Tick: 31.422596ms
[2024-07-11 08:40:45.356] [server] [debug] Tick: 2.541483ms
[2024-07-11 08:40:45.387] [server] [debug] GameWorld.Progress Tick: 30.890145ms
[2024-07-11 08:40:45.390] [server] [debug] Tick: 2.353969ms
[2024-07-11 08:40:45.421] [server] [debug] GameWorld.Progress Tick: 31.384495ms
[2024-07-11 08:40:45.423] [server] [debug] Tick: 2.319509ms
[2024-07-11 08:40:45.460] [server] [debug] GameWorld.Progress Tick: 36.386168ms
[2024-07-11 08:40:45.462] [server] [debug] Tick: 2.295264ms
[2024-07-11 08:40:45.488] [server] [debug] GameWorld.Progress Tick: 25.614537ms
[2024-07-11 08:40:45.490] [server] [debug] Tick: 2.313796ms
[2024-07-11 08:40:45.521] [server] [debug] GameWorld.Progress Tick: 31.39054ms
[2024-07-11 08:40:45.524] [server] [debug] Tick: 2.412143ms
[2024-07-11 08:40:45.556] [server] [debug] GameWorld.Progress Tick: 31.907224ms
[2024-07-11 08:40:45.558] [server] [debug] Tick: 2.490557ms
[2024-07-11 08:40:45.589] [server] [debug] GameWorld.Progress Tick: 30.800417ms
[2024-07-11 08:40:45.591] [server] [debug] Tick: 2.38725ms
[2024-07-11 08:40:45.626] [server] [debug] GameWorld.Progress Tick: 35.082734ms
[2024-07-11 08:40:45.629] [server] [debug] Tick: 2.36161ms
[2024-07-11 08:40:45.656] [server] [debug] GameWorld.Progress Tick: 26.950776ms
If we add the Tick with the GameWorld.Progress Tick together, we get our 30hz tick rate (woohoo). There’s some variability, but overall it seems to hold steady around 30hz. It’s unfortunately hard to tell how much time is spent “sleeping” in the GameWorld.Progress versus active work being done as it will sleep to meet the tick rate I set. I’m sure flecs has a debug flag for this, I’ll just need to dig it up.
But for now, the fact that I’m not wildly overbudget for 300 clients with a pretty unoptimized game engine, I couldn’t be happier.
